News
News from MEC Management
- Details
- Last Updated on Wednesday, 19 October 2011 17:35
The Bakken Formation: How Much Will It Help?
Posted by Gail the Actuary on April 26, 2008 - 10:00am
Topic: Supply/Production
Tags: bakken, bakken shale, williston basin [list all tags]
This is a post by Piccolo, a petroleum engineer working in the petroleum industry.
The Bakken formation in North Dakota and Montana has generated a lot of buzz in the past year. Reserve numbers in the billions of barrels, even tens or hundreds of billions show up in press reports and blogs. Now the USGS has weighed in with a comprehensive assessment of the resource. So just how much will this oil accumulation help the world's largest importer of oil? Is it time to relax or is this just another small blip in the long-term decline of domestic production? We'll examine these questions and others below the fold, using data from the IHS database.

Overview of the Bakken
The Bakken formation is an oil-bearing strata covering parts of Montana, North Dakota, and Saskatchewan. Oil was first produced from the Bakken more than 50 years ago. Production was mainly from a few vertical wells until the 1980's when horizontal technology became available. Only recently after the intensive application of horizontal wells combined with hydraulic fracturing technology did production really take off.
The Bakken is one of many hydrocarbon producing formations in the Williston Basin, a sedimentary basin covering parts of three states and two provinces. The total layer of sediments in the basin can be up to 15,000 ft thick, and within that, the Bakken itself reaches a maximum thickness of about 150 ft., but is thinner in most areas. The depth to the top of the Bakken can vary from a few thousand feet in Canada to more than 10,000 feet in the deeper areas in North Dakota. In terms of geologic age, it was deposited during the upper Devonian and Lower Mississippian periods about 360 million years ago. The entire stratigraphic column for the Williston Basin is shown below. Figure 2 indicates 15 primary producing formations in the basin, including the Bakken.

The Bakken shale consists of three members, the upper, middle, and lower. The upper and lower members are similar, and can be characterized as a gray or black organic-rich shale. The middle member is more like a conventional reservoir with siltstones, sandstones, dolostones, and limestones. The middle member has been a target for many horizontal wells, but more recently the upper and lower horizons are also being seen as important reservoirs. For a more complete description of the Bakken, see the 2001 USGS study Diagenesis and Fracture Development in the Bakken Formation, Williston Basin: Implications for Reservoir Quality in the Middle Member, by J Pitman, L Price, and J LeFever.
Two key properties of reservoir rock are porosity and permeability. Porosity is a measure of how much "empty" volume the rock has space available to store hydrocarbons, water, or gas. Really good formations can have porosities of 20% to 30% or more. Permeability is a measure of how easily fluid can flow through the rock. The best reservoirs have permeabilities of 1 to 5 darcies or more. (1 Darcy = 1000 millidarcies: better reservoirs are usually measured in darcies, and poorer reservoirs in millidarcies.) These high porosities and permeabilities can be found in many world class prolific oil and gas fields, such as the offshore Gulf of Mexico, the North Sea, and Saudi Arabia.
The majority of currently producing reservoirs in the onshore US are by contrast much "tighter." A pretty good reservoir might have porosities of 10% to 15% and permeabilities of 1 to 100 millidarcies (0.001 to 0.1 darcy). Reservoirs with those properties by and large would be considered very desirable reservoir in most of the onshore US and Canada. Moving downward on the scale of reservoir quality, many thousands of wells in the US are now being drilled in so-called "resource plays." These are thick, laterally extensive reservoirs usually covering thousands of square miles, and filled with hydrocarbons, but they are difficult to exploit. The Bakken Shale, along with formations like the Barnett, Fayetteville, and Woodford shales fall into this category. Permeabilities can be in the range of .00001 to .01 millidarcies, with porosities in the range of near zero to maybe 10% or a bit higher.
Porosity and permeability can vary widely and unpredictably over short distances. There are many stories on oil field lore about dry holes drilled next to prolific producing wells, with little explanation geologically about why this might occur. This phenomenon is one of the primary risks that oil producers take when they drill wells, especially in new areas or highly variable reservoirs.
The Pittman/Price/LeFever study cited above reports a wide range of measured permeabilities and porosities in the Bakken, but the average is low. One part of the report gives the average porosity and permeability for the middle Bakken as being 5% and 0.04 millidarcies.
In many of these very tight reservoirs, natural fractures play a big role. These are natural cracks which have low porosity but can have permeabilities one to several orders of magnitude greater than the rock fabric or matrix. Most of the better wells in the Bakken have encountered abundant natural fractures.
Even with an extensive natural fracture system, often times additional help is needed to create an economic well. This is where hydraulic fracturing comes in. Fluid, sometimes with sand or other material ("proppant") is pumped at high pressure into the formation. The pressure is high enough to create large artificial fractures that can extend hundreds of feet from a wellbore. Proppant holds the fracture open, and creates a permeable channel to allow hydrocarbons to flow to the wellbore. Production in many, or perhaps most, of the producing formations in the US is improved by hydraulic fracturing. When hydraulic fracturing is combined with horizontal wells (and high enough commodity prices), many of the shale or resource plays become economic to produce.
Oil in Place and Reserves
To understand how much oil might be producible from the Bakken, we need to get there in a couple of steps.
The first step is "oil in place." The Bakken is postulated to be both source rock and reservoir. Over millions of years organic matter is cooked under heat and pressure to produce hydrocarbons. In many areas, the oil created by the source rock slowly migrates to another location where it is trapped and later found as an oil or gas reservoir. In the case of the Bakken, these layers contain source material, but the hydrocarbon was cooked in place and little or none of the created hydrocarbon migrated to other potential reservoir rocks. The Pittman/Price/LeFever study estimates the volume of oil generated at 200 to 400 billion barrels, which we can more or less equate to an estimate of oil in place.
The next step is to estimate how much oil could be recovered (produced). For a reservoir such as this, the range of recovery can very widely. Good reservoirs with "water drive" can have recoveries of more than 30% of oil in place. As reservoir quality decreases, so does recovery factor. In very tight reservoirs, recovery would probably be in the range of less than 1% to around 10%, depending on many factors like porosity, permeability, presence of fractures, well spacing, etc.
In the good areas of the Bakken, with higher porosity and lots of fracture permeability, the recovery might range as high as 5% to possibly 15%. Typically only a few areas, or "sweet spots," will have recovery this high. Outside the sweet spots, recoveries are likely to be much lower; the reservoir quality will deteriorate, with lower porosity, lower permeability, and fewer fractures, and/or thinner beds of reservoir rock. In these areas, recovery will probably be less than 5% of the oil in place, and in some areas less than 1%. Estimating recovery factor in shale reservoirs is more an art than a science; only after several years of production, and with very good data, can a reliable range of recovery be estimated.
In the less favorable and thinner areas of the reservoir, even though it might be technically possible to recover 1% or 2% of the oil in place, the risk may be too high to for an operator to be willing to spend $3 to $5 million or more, with no assurance that the well will pay out. In this case the "technically recoverable" reserves might be 1% of oil in place, but the economically recoverable reserves are 0% if an operator is not persuaded to risk capital to drill a well.
Some of the recent articles have suggested a Bakken recovery as high as 50%, but that is highly doubtful in my view. Recoveries that high only occur in a few really good world class reservoirs, and, even there, often require secondary or tertiary recovery techniques.
The USGS 2008 estimate
The discussion above now gives us a context with which to understand the recently released USGS estimate. So far, only a two-page summary of findings was released. We do not have access yet to the detailed report that backs up the summary, but we can make a number of inferences from the information provided.
The USGS summary indicates that their estimates are "undiscovered, technically recoverable oil and gas resources of the Bakken Formation in the United States." The term "undiscovered" suggests that the currently known reserves have been excluded from their totals. "Technically recoverable" has not been defined in the USGS summary; we will need to wait for the detailed report to find out their definition. In the mean time, one reasonable definition might be "the volume of hydrocarbons that theoretically could be produced if enough wells were drilled to drain the entire known area of Bakken oil accumulation".
We can contrast "technically recoverable" to "economically recoverable," a term which can be taken as the amount of producible reserves that will give a reasonable return on capital invested. The volume of economically recoverable reserves will change as oil price, cost of wells, etc. vary. In reality, some of the areas of poorer reservoir will never be drilled because of poor economics: the cost and risk will not be offset by the expected recovery of oil. It is true that more of these marginal areas will be exploited as the price of oil rises.

The USGS estimated reserves probabilistically, as indicated by the P95, P50, P5, and mean values on the table above. (P95, for example, indicates that there is a 95 percent chance that the reserves value given will exceed this value.) Using the mean value as a representative number for the distribution, the USGS estimate that there are 3,649 million barrels of technically recoverable oil in the entire US Bakken accumulation. Associated with the oil production are 1,850 billion cubic feet of natural gas and 148 million barrels of NGL's. On an equivalent energy basis, about 90% of the energy value is in the oil, with the remaining percentage in the gas and NGL's.
Ok, so now we have an estimate of undiscovered reserves. How does that compare to known or discovered reserves? Our estimate is that the Bakken has produced about 111 million barrels so far in North Dakota and Montana. Although it's a rough guesstimate, we could say that perhaps 3 times to 5 times the produced volume constitutes "discovered resources." This would include the "proven" category of remaining production from existing wells, plus the immediate areas around the wells, plus additional area that is more speculative but could yield some production. Let's be clear that the term "total discovered resource" is very fuzzy. Who is to say where the discovered technically recoverable reserves stop and the undiscovered resources begin?
Using the round numbers of 300 to 500 million barrels of oil discovered resources, we can then say that the mean USGS undiscovered resources are 7 to 12 times the size of the already discovered resources. Using the combined undiscovered and discovered resource estimates, we can take a stab at the implied recovery factor. If we choose the value of 500 million barrels for discovered resources, we find that the implied recovery factor (oil produced / oil in place) is 1.0 % = (3,649+500/400,000) to 2.1% = (3,649+500/200,000).
Will Bakken ever produce as much as 4.1 billion barrels (= 3,649+500 million barrels), the amount suggested by the USGS estimate? It seems very unlikely. Production so far has been 111 million barrels. If the industry is able to discover several more prolific areas such as the Elm Coulee field in Montana (43 million barrels, or 38% of the Bakken oil recovered to date), it might be possible to increase this recovery to 500 million barrels, or 4.5 times the current production. Is total production of 500 million barrels likely? It's difficult to say. The USGS estimate is vastly higher than this, so much less likely.
If 500 million barrels turns out to be the ultimate recovery, the recovery factor would range from 0.13% to 0.25% of estimated oil in place. This very low percentage recovery of the estimated oil in place is not unreasonable if one considers that many of the more marginal areas of the field are likely to be deemed sub-economic and will never be drilled and produced. Technology improvements that will inevitably be made during an era of high energy prices will undoubtedly render some of this more marginal oil recoverable, but the total recovery is still likely to be low.
The USGS numbers are notable for their apparent certainty of the size of the undiscovered resources. The p5/p95 ratio is one measure of the spread or uncertainty of a probabilistic estimate. The USGS oil numbers show ratios of 1.2 to 1.9, which is quite surprising. These low ratios imply that the USGS is highly confident in their recoverable resource estimates. One would have thought that a 5X or 10X spread in this ratio would be more plausible considering that 85% to 90% of the resources has not yet been discovered. Perhaps when the detailed report is released, the logic behind this narrow range will be revealed. In the mean time, I remain highly skeptical that such a large resource with an unknown variability of fracture density, porosity, and recovery factor, and other factors, can be quantified with such precision.
If we could actually produce 3.6 billion barrels of undiscovered oil forecast at the P50 level by USGS, how much would this equate to? The US uses about 7.6 billion barrels of oil products a year, according to EIA data. This is equivalent to just under six month's US oil use, spread over a very long period, probably 20 years or more. If total production amounts to only 500 million barrels, as I have suggested, this would equate to about 23 days worth of United States oil usage, spread over many, many years.
Looking at future production another way, the recent peak in production has been 75,000 barrels of oil per day (discussed in more detail below). Even if operators are able to triple this amount, the resulting production of 225,000 barrels a day (which would be a considerable challenge), will amount to only about 1.1% of US oil consumption, assuming the US uses about 20.7 barrels of oil a day, based on EIA data.
If we can reach 225,000 barrels of oil per day, the history of Bakken suggest this level would be short-lived - the peak production will probably last for a year or less - because as we shall see below, total Bakken production can be expected to decline to 50% or less of its peak rate within a few years, because of the steep decline rate of individual wells.
Bakken production history
To understand historical Bakken production, we utilized a commercially available production database (IHS) that contains monthly production for all Bakken wells in Montana and North Dakota. This database, while not in exact agreement with state data, is accurate enough to discern general trends. A cross check of state records indicates that the total production and well numbers for the individual states indicated by the database are within a few percent of those recorded by the individual states.

The production history of the Bakken in Montana and North Dakota (Figure 3) can be divided into three phases, a) vertical well production prior to 1985, b) the first wave of horizontal well production up to 2004, and c) the second wave of horizontal production since 2004. Clearly the second wave of horizontal production has had a huge impact, which can be credited to several improvements over the technology of the 1990s. These improvements include, among other things the ability to drill longer horizontal and multilateral wells from a single vertical wellbore, and improved hydraulic fracturing technology. The first wave of horizontal well technology boosted Bakken production to an April 1991 peak of 11,790 barrels of oil per day (BOPD). Constrast that with the most recent peak in October 2007 of 75,000 BOPD.
As a quantification of the importance of horizontal wells, the proportion of Bakken horizontal wells (including multilateral), as a percentage of total wells, increased from 0% in 1980, to 50% in 1990, 78% in 1995, and 95% today.

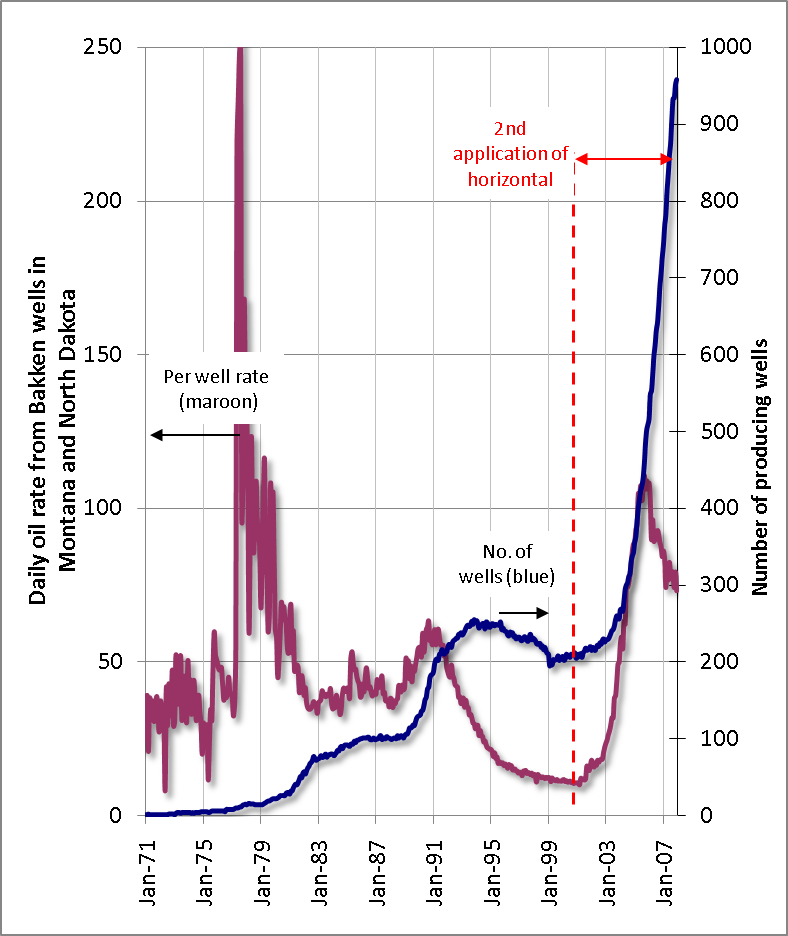
If we consider the number of wells being drilled, and how it affected production, a key point arises from Figure 4. There is distinct peak and rapid decline of production in 1991, even though the number of wells increased for two more years after the production peak. This is one of the harsh realities of oil and gas production, especially in tight, fractured reservoirs. The wells may individually reach peak production rates of 500 barrels of oil per day (BOPD), 1,000 BOPD, or more, but the peak is normally very short lived because it is followed by a rapid decline that can be anywhere from 20% to 60% per year for the next couple years. After an initial rapid decline, the well may produce at low rates and less decline for many years afterward, but usually high well rates anywhere close to the original rate can never be achieved. Combining many wells with this high rate / rapid decline characteristics means that it may be possible to achieve a high field production rate, but only for a short time, and drilling additional wells often will not be enough to offset the overall field decline.
Production of wells in a field is usually log-normally distributed. A few wells produce at high rates, and most of the wells produce at less than average rates. In a typical field the best 20% of wells pay for the other 80%. It's a numbers game - unless one is lucky enough to hit a big well on the first try, one needs to stay in the game long enough to drill enough wells to achieve an acceptable statistical average.
The field decline during the period of February 1993 to February 1997 is about 25% per year. If many new wells were not being drilled and put into production during this decline period, the overall decline would be considerably steeper. Note that after January 1997, the decline flattens somewhat; this would be the beginning of the long "tail" period of production from existing wells, characterized by low producing rates with shallower decline.
If we consider average production per well (Figure 5), we find that its behavior may be predictive of later field decline. The average production per well is simply the total reported Bakken production for the period, divided by the total number of wells producing during the period. If a well is drilled and goes on production in a certain period, the well count goes up by one, and the well's production gets added to the total. If a well becomes uneconomic during the period, and the operator stops producing the well, the well count goes down by one. In any given month, wells that come on at high rates of say, 1,000 BOPD, are averaged with wells already on production that may be producing 100 or 50 BOPD. If there is a population of wells already producing and on decline, bringing on more wells at temporarily high rates (the 1,000 BOPD may last for one month or two months max in most cases) will only raise the average production slightly.
For the first wave of horizontal technology, the per-well production peaked in August 1990 at 71 BOPD per well, with 142 wells producing. The per-well production then declined, even though additional wells were brought on production for the next 4 years. In August 1994, the peak well count of 235 wells was reached, but by then the average per well rate was only 22 BOPD. Interestingly and perhaps alarmingly, the 2nd wave of Bakken horizontal well production reached in August 2005 a peak per-well rate 116 BOPD per well, with 433 wells on production. Based on production in the early 90's this may portend a near term decline in Bakken total production. As of October 2007, however, the total Bakken production rate was still rising rapidly.
Even if Bakken production should peak in the next year or two, this doesn't necessarily mean a permanent decline in production. Past history shows that some combination of new technology, new discoveries, and higher prices could lead to another uptick in production.
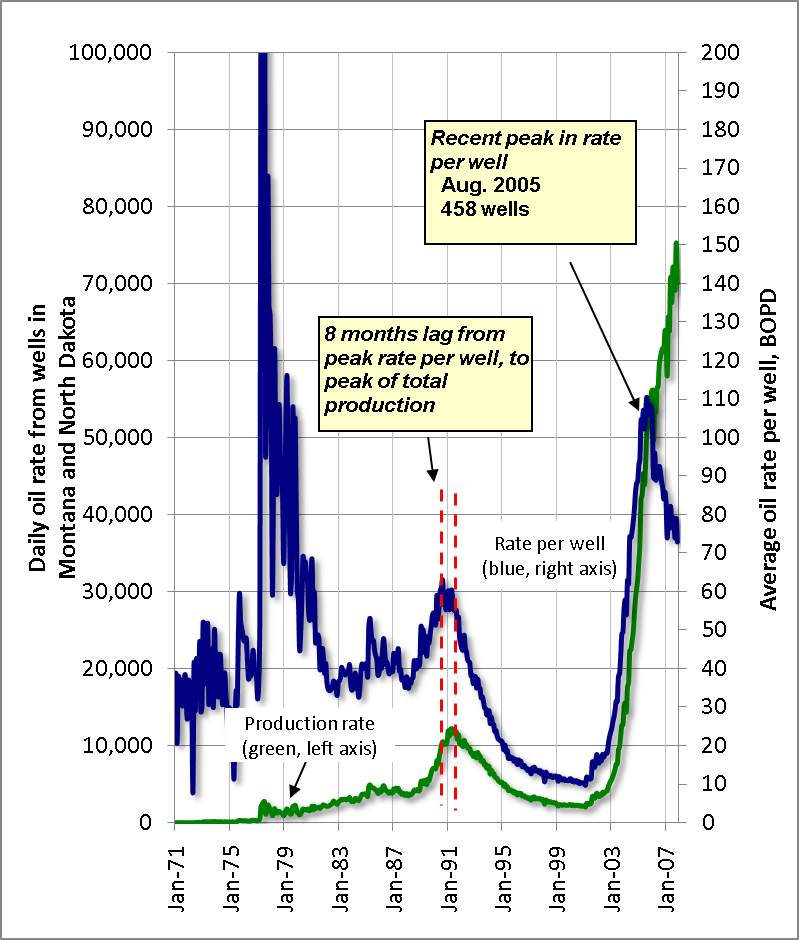
Comparing per well rates and total producing rates in Figure 6, there was an eight-month lag from the peak per well rate in August 1990 to the peak Bakken production rate in April 1991. As was mentioned above the peak in total Bakken rate occurred in spite of the fact that wells continued to be drilled and brought on production during the next four years. We are now 26 months past the August 2005 per-well peak, so that's encouraging. That's 26 months up to October 2007, the last month plotted in this graph.
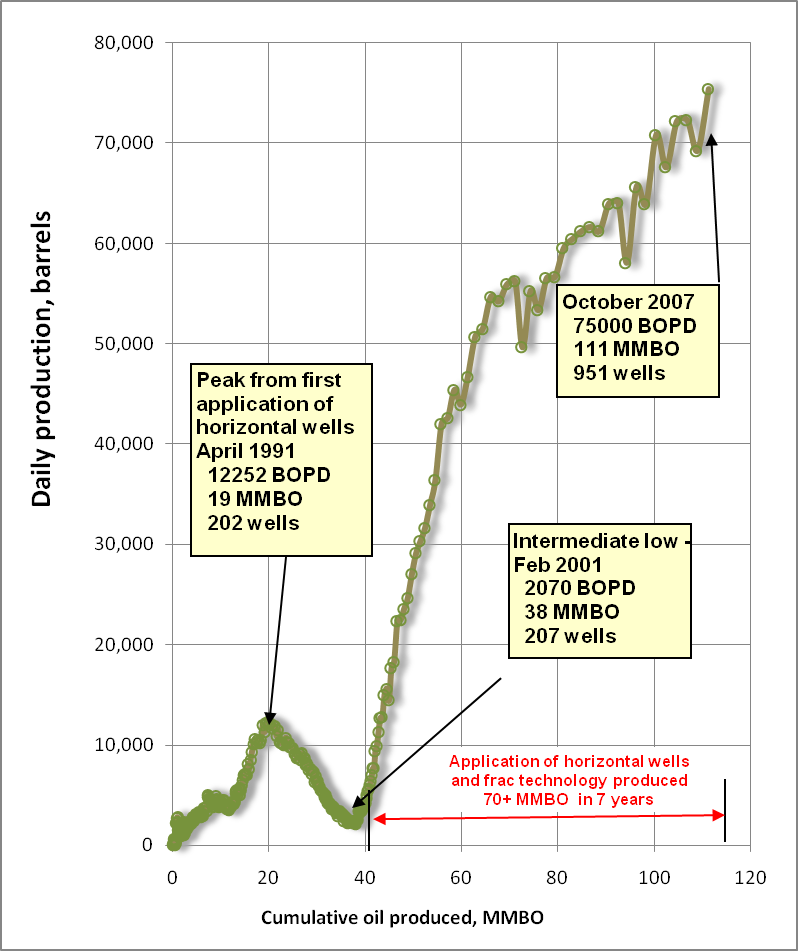
Looking at the total Bakken production vs. the cumulative production (Figure 7) will allow us to approximate produced volumes of the two waves of horizontal technology. The first wave production curve indicates that if no new wells were drilled, the ultimate recovery would have been about 41 million barrels. The second wave of horizontal technology did indeed dwarf the first wave, and we can say that so far the second wave has added about 70+ million barrels of production.
The first wave of horizontal technology peaked at about 20 million barrels, with an ultimate recovery of about double that, or 41 million barrels. Using this analogy, if the industry were able to keep up the current rate of increase for the next two years, and reach a peak production at 150 million barrels cumulative recovery, ultimate recovery could reasonably be estimated as being around 300 million barrels, without additional new waves of development.
What's next for the Bakken?
Bakken production is trending upward and should continue for some time. The October 2007 production of 75,000 BOPD equates to 27 million barrels per year, a substantial amount by most measures for the US onshore sector. This only amounts to about 0.4% of US consumption (using a base of 20,700 BOBP, based on EIA data), or 0.6% of US imports.
Drilling activity in the Bakken continues at a frenetic pace. It's difficult to predict how long the upward trend in production will continue. Over the long term, economics will play a significant role in determining how much production will be expanded.
Conclusions
1. The Bakken shale has produced about 111 million barrels of oil during the last 50+ years in Montana and North Dakota.
2. Total Bakken production is still rising, and producing at the rate of 75,000 BOPD in October 2007.
3. Because of the highly variable nature of shale reservoirs, the characteristics of the historical Bakken production, and the fact that per-well rates seem to have peaked, it seems unlikely that total Bakken production will exceed 2x to 3x current rate of 75,000 BOPD.
4. The latest boom in Bakken production is driven by the application of horizontal wells and hydraulic fracturing technology, which has added about 70 million barrels of production in 7 years. Ultimate recovery of the already-drilled wells should be at least double this volume.
5. The USGS estimates the mean volume of technically recoverable hydrocarbons to be 3,649 million barrels of oil. This is roughly 7 to 12 times the size of already known resources.
6. Based on current production and areas likely to be drilled, the USGS estimate of technically recovery resources seems optimistic.
7. The Bakken potential resource, while large by US onshore field standards, will have only a minor effect on US production or imports. Using 2006 US imports and consumption for comparison, the Bakken undiscovered resource of 3,649 million barrels of oil, if subsequently discovered and fully developed, would provide us with the equivalent of six months of oil consumption or 10 months of imports, spread over 20 or more years. In reality, the reserves developed are likely to be many times smaller than this value.
8. The October 2007 production rate of 75,000 BOPD amounts only 0.4% of US oil consumption, or 0.6% of imports.
9. Per-well Bakken production peaked in August 2005 at 116 barrels a day, and was down to 79 barrels a day in October 2007. If the Bakken production history in the 1990s can be used as a guide, the peaking of per-well production may portend a peak in total Bakken production.


